Published November 6, 2026. Last updated November 9, 2026.
Short answer
Track seven HR metrics each quarter: headcount, turnover, time to fill, offer acceptance, early exits, absence and pay position against the range. Put them on one page with a trend line and a one-sentence reading of each. A metric earns its place only if a number moving would change a decision you would make.
Track seven HR metrics each quarter: headcount, turnover, time to fill, offer acceptance, early exits, absence and pay position against the range. Put them on one page with a trend line and a one-sentence reading of each. A metric earns its place only if a number moving would change a decision you would make.
I am Mac Malbrough. I hold a J.D. and an MS-HRM, I am not an attorney, and I help small employers turn payroll and hiring records into decisions. The numbers in the examples are hypotheticals I made up to show the arithmetic, and they are not benchmarks or client results.
Why do small employers collect HR data and never use it?
Payroll, the hiring spreadsheet, the schedule and the leave log each hold part of the picture, and nobody has the job of putting the parts together. So the data sits in four places and the decisions get made on a feeling: “we seem to lose people a lot,” “hiring takes forever,” “the schedule is chaos.” Feelings are hard to argue with and hard to fix. A number you can point at changes the conversation.
The other trap is the opposite: a dashboard with 30 metrics that nobody reads. Small teams do better with a short list that connects to decisions. That is what HR analytics means at this size. It is not a data science project. It is a habit of counting the right things the same way every quarter and asking what changed.
Which seven metrics should you track?
Here is the short list, with the formula and the decision each one supports.
Headcount: how many people are on the payroll at the end of the quarter, split by full time, part time and by team. It answers whether you are growing, shrinking or standing still, and it is the denominator for most of the rest.
Turnover rate: separations in the period divided by average headcount in the period. Split it into voluntary and involuntary, because the fixes are different. A rising voluntary rate points at pay, schedule or management, and a rising involuntary rate points at hiring.
Time to fill: days from the approved opening to the accepted offer. It tells you whether the process is slow or the market is. It matters most for roles where an empty seat costs you sales or service.
Offer acceptance rate: offers accepted divided by offers made. A low rate suggests pay, speed or a mismatch between the post and the job.
Early exits: people who left within 90 days divided by people hired in the period. This is the best single signal of whether hiring and onboarding are working together. The article on hiring and onboarding as one system shows how to act on it.
Pay position: each person’s pay as a share of the midpoint of the range for their role. It shows who is below the range, who is above it and where compression is building.
Notice what is missing: satisfaction scores, engagement indexes and anything that needs a survey platform. Those can be useful, but they are not where a small employer should start. Counting is cheaper than asking, and the seven numbers above already come from records you keep.
Where do the numbers come from?
Almost always from three places. Payroll gives you headcount, pay and separations with dates. Your applicant tracking sheet gives you openings, offers and accepted offers. Your schedule or time system gives you absence. If you are using HR software, the reports section will hand you most of these, and HR software for analytics and employee experience covers what to expect. If you are not, a spreadsheet with one row per employee and one row per opening is enough.
Two habits keep the data trustworthy. First, define each metric in writing once and keep the definition. If “separation” includes retirements this quarter and not the next, the trend means nothing. Second, record the date of every event at the time it happens. Reconstructing dates from memory three months later is how a clean metric turns into a guess.
How do you build a one-page dashboard?
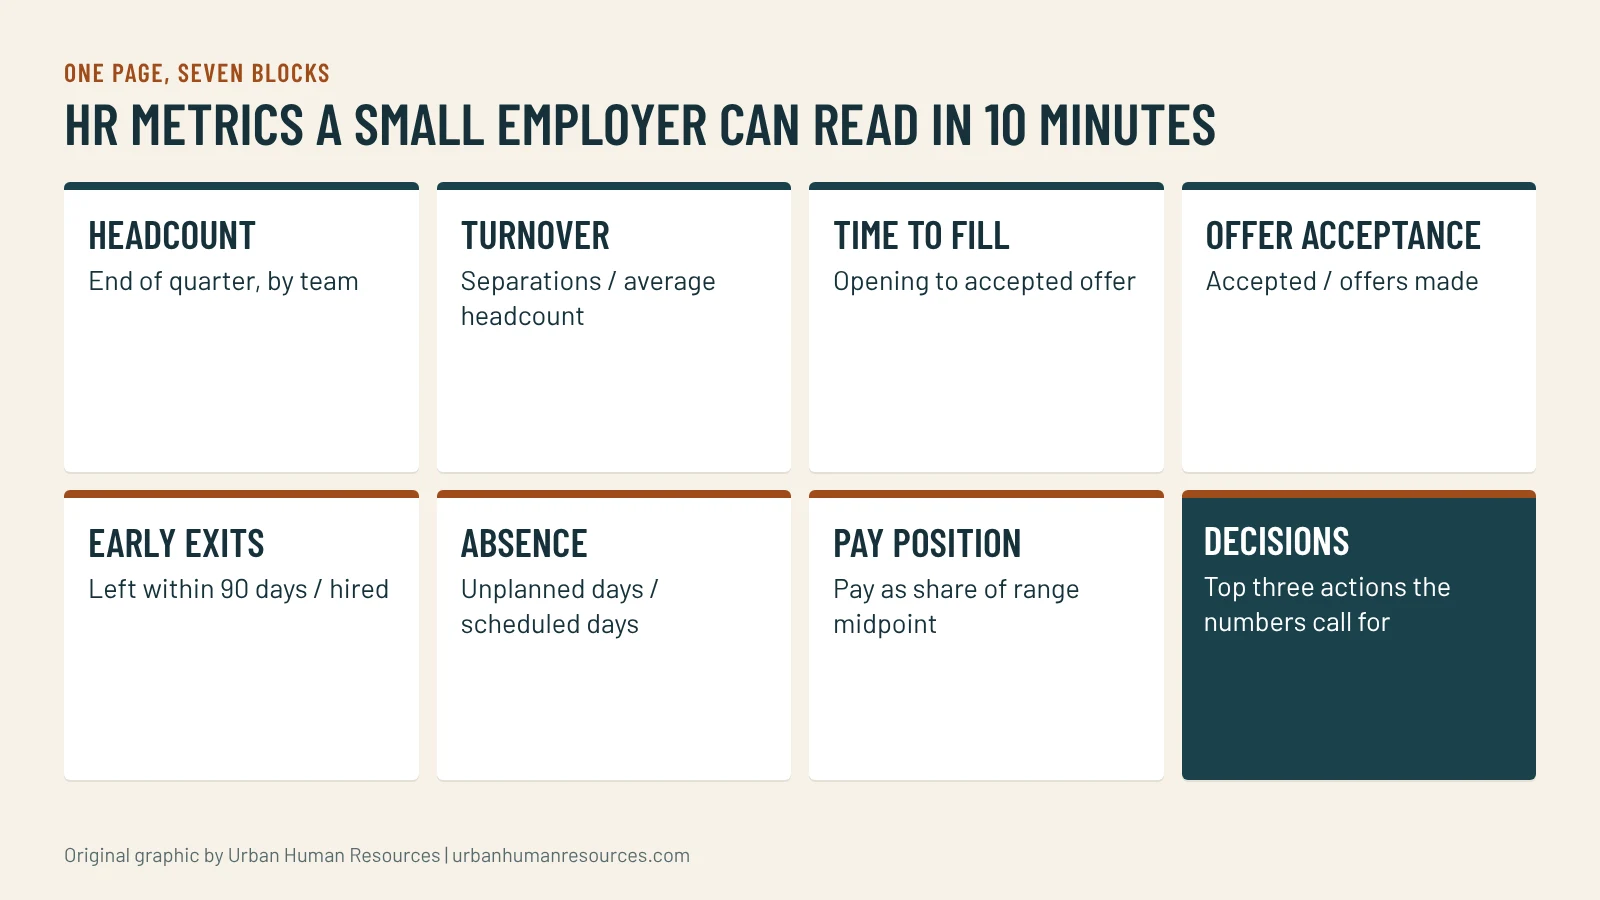
Use one page with seven small blocks, one per metric. In each block put four things: the number for this quarter, the number for the last four quarters as a tiny trend, a one-sentence reading and the decision it feeds. Then add a short box at the bottom with the top three things you will do because of what the page shows.
A hypothetical example of one block: “Early exits: 3 of 8 hires left within 90 days this quarter, up from 1 of 9 last quarter. Reading: the two new evening-shift hires left after the schedule changed in week three. Decision: lock the schedule in the offer and the first month.” The reading is the valuable part. A number without a sentence invites everyone to project their own story onto it.
Original graphic by Urban Human Resources.
How do you explain the numbers to an owner or a board?
Lead with the decision, not the data. Owners do not need a lecture on turnover formulas. They need to hear: “We lost three people in 90 days, all on the evening shift, after a schedule change. Here is what it cost to replace them and here is the fix.” The sequence is the finding, the cost, the cause and the action.
When you put a cost on a finding, show the arithmetic and label any estimate. For example, if a replacement takes 20 hours of a manager’s time at a loaded cost you calculate from your own payroll, show the hours and the rate. Do not quote an industry figure for what a hire costs unless you can name the source and read it yourself. Your own numbers are more persuasive anyway, because the owner knows they are real.
What should you watch out for when you read HR data?
Three cautions keep small-team numbers honest.
Small samples swing wildly. If you have 12 employees, one departure moves your turnover rate by several points. Read the trend over four quarters, and read the names behind the number.
Averages hide gaps. An average pay position near the midpoint can conceal one group far below it. Always cut pay by role, tenure and, where you are legally able and doing it for an audit, by protected group. The pay equity check without a PEO shows how to do it carefully.
Data about people is sensitive. Keep the dashboard at the group level, restrict access to the underlying records and do not put individual medical, leave or complaint details on the page.
Be careful, too, about turning metrics into targets for managers without thinking through the incentives. A manager measured only on turnover may stop hiring people who are likely to leave, which can slide into screening out people for reasons you cannot defend. Use the numbers to ask questions, not to punish.
How often should you review the numbers?
Quarterly for the full page, monthly for a quick look at headcount, early exits and open roles. Put the review on the calendar with the owner or leadership team, and give it 30 minutes. The routine matters more than the tool. After a few quarters you will see patterns that a single snapshot cannot show, such as a seasonal spike in absence or a recurring dip in offer acceptance in the same month.
What should you do this week?
Build the early-exit and turnover blocks first. Pull the last four quarters of hires and separations from payroll, compute both rates and write one sentence about what you see. That single exercise usually tells you whether your next investment belongs in hiring, onboarding, pay or management.
This article gives formulas and a method, not statistics or benchmarks. Every number in the examples is a hypothetical. The pay equity method is covered with its sources in the linked page.
McKinley holds a J.D. but is not a licensed attorney. Articles here are general information, not legal advice. For your specific situation, talk with an employment attorney.
Data current as of November 2026. Sources are linked where each figure appears.
This article is general information, not legal advice. Laws change and every situation is different; for advice on yours, talk with an employment attorney.
My Part 5 guide to people analytics, HR help desks, frontline communication apps and contractor management tools for California small employers, with prices checked October 2026.
The median job takes about 45 days to fill, and most companies never measure whether the hire worked. Recruiting best practices for small businesses, from the intake meeting to a signed offer.
A California small business owner can review pay by sex, race and ethnicity in an afternoon with a spreadsheet. The law behind it, the steps I use and the point where a…